Monitoring Systems using Grafana, InfulxDB and Prometheus
Monitoring Proxmox system the easy way
We are going to be using docker and docker compose to complete this setup to work in monitoring your systems.
Here is the compose file you will need:
services:
  prometheus:
    image: prom/prometheus
    container_name: prometheus
    command:
      - '--config.file=/etc/prometheus/prometheus.yml'
    ports:
      - 9090:9090
    restart: unless-stopped
    extra_hosts:
      - "dockersrv002:host-gateway"
    volumes:
      - ./prometheus:/etc/prometheus
      - prom_data:/prometheus
  grafana:
    image: grafana/grafana
    container_name: grafana
    ports:
      - 3000:3000
    restart: unless-stopped
    volumes:
      - ./grafana:/etc/grafana/provisioning/datasources
      - grafana_data:/var/lib/grafana
  influxdb:
    image: influxdb:2.7.6-alpine
    container_name: influxdb2
    ports:
      - 8086:8086
    extra_hosts:
      - "dockersrv002:host-gateway"
    volumes:
      - influxdb2_data:/var/lib/influxdb2
      - ./influxdb2/config:/etc/influxdb2
      - ./influxdb2/scripts:/docker-entrypoint-initdb.d
volumes:
  prom_data:
  grafana_data:
  influxdb2_data:
Grafana Configuration files
datasource.yml
apiVersion: 1

datasources:
- name: Prometheus
  type: prometheus
  url: http://prometheus:9090
  isDefault: true
  access: proxy
  editable: true
Prometheus Configuration files
global:
  scrape_interval: 15s
  scrape_timeout: 10s
  evaluation_interval: 15s
alerting:
  alertmanagers:
  - static_configs:
    - targets: []
    scheme: http
    timeout: 10s
    api_version: v1
scrape_configs:
- job_name: prometheus
  honor_timestamps: true
  scrape_interval: 15s
  scrape_timeout: 10s
  metrics_path: /metrics
  scheme: http
  static_configs:
  - targets:
    - localhost:9090
- job_name: node_exporter
  static_configs:
    - targets:
      #- dockersrv002:9100
      #- 192.168.10.171:9100
      #- 192.168.30.99:9100
Prometheus Node Exporter on RaspberryPi 4
Install the node exporter software
Get the latest version from the github prometheus project
https://github.com/prometheus/node_exporter/releasesSelect the version you need arm6 for raspberrypi 3 or arm7 for Raspberrypi 4
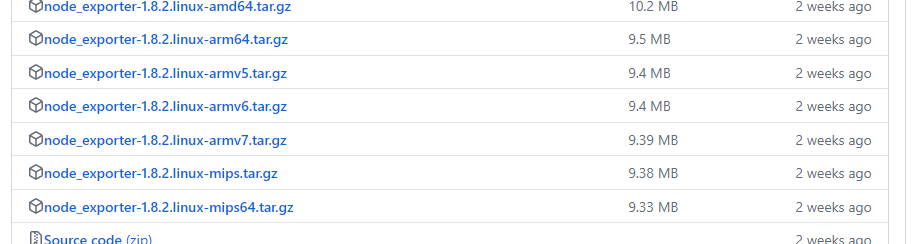
Next you will download the qzip file and extract it, copy to the user path then create a service file to start and run the service
tar -xvf node_exporter-1.8.2.linux-armv7.tar.gz
cd  node_exporter-1.8.2.linux-armv7/
sudo cp node_exporter /usr/local/bin
sudo vi /etc/systemd/system/node_exporter.service
You will next past the following into the service file.
[Unit]
Description=Node Exporter

[Service]
# Provide a text file location for https://github.com/fahlke/raspberrypi_exporter data with the
# --collector.textfile.directory parameter.
ExecStart=/usr/local/bin/node_exporter

[Install]
WantedBy=multi-user.target
Next need to reload daemon and, enable service, start service and check status
sudo systemctl daemon-reload
sudo systemctl enable node_exporter.service
sudo systemctl start node_exporter.service
sudo systemctl status node_exporter.service